
Note
Go to the end to download the full example code.
FOCI rank-mean NN tie breaking#
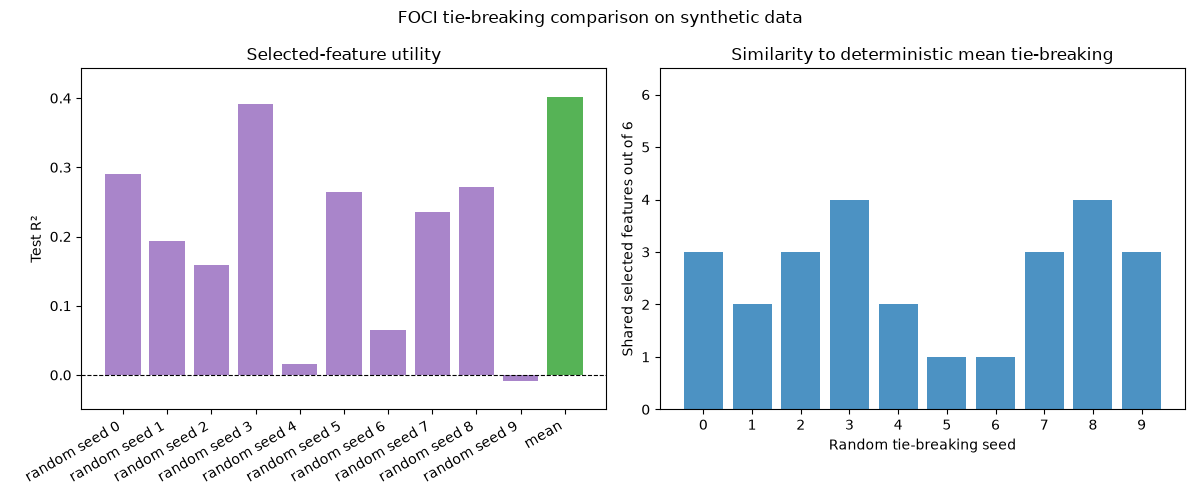
This example compares FOCI with nn_tie_breaking="random" across several
seeds against deterministic nn_tie_breaking="mean".
The synthetic features are discrete, which creates many nearest-neighbor ties in low-dimensional selected feature subspaces. The target depends on several similarly informative features, making the selection problem intentionally ambiguous. This makes it possible to see how random nearest-neighbor (NN) tie-breaking can affect the selected feature subset while mean tie-breaking gives a deterministic result – in this case even better than the others. A poor random NN tie-breaking can even score below the constant-predictor baseline on held-out data (negative test R²).
========================================================================================
FOCI tie-breaking comparison on synthetic data (n=450, p=35, k=6, levels=4)
========================================================================================
Run              | Test R²  | MAE      | Features
----------------------------------------------------------------------------------------
random seed 0    |   0.2904 |    2.986 | ['x2', 'x0', 'x7', 'x9', 'x3', 'x1']
random seed 1    |   0.1936 |    3.257 | ['x0', 'x6', 'x19', 'x17', 'x1', 'x7']
random seed 2    |   0.1587 |    3.219 | ['x10', 'x31', 'x2', 'x9', 'x14', 'x1']
random seed 3    |   0.3910 |    2.755 | ['x9', 'x2', 'x11', 'x12', 'x4', 'x1']
random seed 4    |   0.0154 |    3.560 | ['x0', 'x1', 'x32', 'x23', 'x6', 'x13']
random seed 5    |   0.2636 |    3.183 | ['x12', 'x7', 'x2', 'x15', 'x5', 'x16']
random seed 6    |   0.0643 |    3.549 | ['x5', 'x3', 'x8', 'x12', 'x2', 'x32']
random seed 7    |   0.2359 |    3.253 | ['x28', 'x0', 'x11', 'x9', 'x1', 'x15']
random seed 8    |   0.2717 |    3.214 | ['x10', 'x4', 'x20', 'x1', 'x7', 'x0']
random seed 9    |  -0.0086 |    3.516 | ['x11', 'x22', 'x32', 'x0', 'x2', 'x31']
mean             |   0.4019 |    2.767 | ['x1', 'x0', 'x4', 'x11', 'x2', 'x10']
========================================================================================

Random tie-breaking summary
--------------------------------------------------
Unique selected feature sets: 10
Test R²:       mean=0.1876, std=0.1230
MAE:           mean=3.249, std=0.240
Overlap with mean run: mean=2.60 out of 6
--------------------------------------------------
import matplotlib.pyplot as plt
import numpy as np
from sklearn.ensemble import RandomForestRegressor
from sklearn.metrics import mean_absolute_error, r2_score
from sklearn.model_selection import train_test_split

from pyFOCI import FOCISelector

# -------------------------------------------------------------------------
# Config
# -------------------------------------------------------------------------
K_FEATURES = 6
N_SAMPLES = 450
N_FEATURES = 35
N_LEVELS = 4
N_INFORMATIVE = 14
DATA_RANDOM_STATE = 0
RANDOM_TIE_SEEDS = list(range(10))
TRAIN_FRACTION = 0.75
PREDICTOR_RANDOM_STATE = 0
TARGET_NOISE = 1.25

# -------------------------------------------------------------------------
# 1. Synthetic data
# -------------------------------------------------------------------------
random_state = np.random.RandomState(DATA_RANDOM_STATE)

# Discrete features create many exact duplicates and equal nearest-neighbor
# distances, especially in the low-dimensional subspaces considered during
# forward selection.
X = random_state.randint(
    low=0,
    high=N_LEVELS,
    size=(N_SAMPLES, N_FEATURES),
).astype(float)

X_centered = X - np.mean(X, axis=0, dtype=float)

# Make many features similarly informative. This intentionally creates an
# ambiguous feature-selection problem: several features carry comparable signal,
# so small differences from random nearest-neighbor tie-breaking can change the
# selected subset.
linear_weights = np.linspace(1.0, 0.75, N_INFORMATIVE)

y = X_centered[:, :N_INFORMATIVE] @ linear_weights

# Add a few nonlinear effects, again spread across several features rather than
# dominated by one obvious variable.
y += 0.7 * (X_centered[:, 0] * X_centered[:, 1])
y += 0.6 * (X[:, 2] >= 2).astype(float)
y += 0.6 * (X[:, 3] == 0).astype(float)
y += 0.5 * np.sin(X_centered[:, 4])
y += 0.5 * (X_centered[:, 5] ** 2 - np.mean(X_centered[:, 5] ** 2))

# Add enough noise that several candidate features remain close competitors.
y += TARGET_NOISE * random_state.normal(size=N_SAMPLES)

feature_names = np.asarray([f"x{j}" for j in range(N_FEATURES)])

X_train, X_test, y_train, y_test = train_test_split(
    X,
    y,
    train_size=TRAIN_FRACTION,
    random_state=DATA_RANDOM_STATE,
)

# -------------------------------------------------------------------------
# 2. FOCI tie-breaking comparison
# -------------------------------------------------------------------------
runs = [
    (
        f"random seed {seed}",
        FOCISelector(
            max_features=K_FEATURES,
            min_delta=None,
            nn_tie_breaking="random",
            random_state=seed,
        ),
    )
    for seed in RANDOM_TIE_SEEDS
]
runs.append(
    (
        "mean",
        FOCISelector(
            max_features=K_FEATURES,
            min_delta=None,
            nn_tie_breaking="mean",
            random_state=0,
        ),
    )
)

results = []
w = 88
print("\n" + "=" * w)
print(
    "FOCI tie-breaking comparison on synthetic data "
    f"(n={N_SAMPLES}, p={N_FEATURES}, k={K_FEATURES}, levels={N_LEVELS})"
)
print("=" * w)
header = f"{'Run':<16} | {'Test R²':<8} | {'MAE':<8} | Features"
print(header)
print("-" * w)

for name, selector in runs:
    selector.fit(X_train, y_train)

    selected_idx = selector.selected_indices_
    selected_names = feature_names[selected_idx].tolist()

    # Same downstream model for all FOCI runs.
    predictor = RandomForestRegressor(
        n_estimators=100,
        random_state=PREDICTOR_RANDOM_STATE,
        n_jobs=-1,
    )
    predictor.fit(X_train[:, selected_idx], y_train)
    y_pred = predictor.predict(X_test[:, selected_idx])

    test_r2 = r2_score(y_test, y_pred)
    test_mae = mean_absolute_error(y_test, y_pred)

    results.append(
        {
            "name": name,
            "r2": test_r2,
            "mae": test_mae,
            "selected_idx": selected_idx,
        }
    )

    print(f"{name:<16} | {test_r2:8.4f} | {test_mae:8.3f} | {selected_names}")

print("=" * w + "\n")

random_results = [result for result in results if result["name"].startswith("random")]
mean_result = next(result for result in results if result["name"] == "mean")

mean_selected = set(mean_result["selected_idx"].tolist())
for result in random_results:
    selected = set(result["selected_idx"].tolist())
    result["overlap_with_mean"] = len(selected & mean_selected)

unique_random_feature_sets = {
    tuple(sorted(result["selected_idx"].tolist())) for result in random_results
}

random_r2 = np.asarray([result["r2"] for result in random_results])
random_mae = np.asarray([result["mae"] for result in random_results])
random_overlap = np.asarray([result["overlap_with_mean"] for result in random_results])

print("Random tie-breaking summary")
print("-" * 50)
print(f"Unique selected feature sets: {len(unique_random_feature_sets)}")
print(f"Test R²:       mean={random_r2.mean():.4f}, std={random_r2.std():.4f}")
print(f"MAE:           mean={random_mae.mean():.3f}, std={random_mae.std():.3f}")
print(f"Overlap with mean run: mean={random_overlap.mean():.2f} out of {K_FEATURES}")
print("-" * 50 + "\n")

# -------------------------------------------------------------------------
# 3. Plotting results
# -------------------------------------------------------------------------
fig, axes = plt.subplots(1, 2, figsize=(12, 5))

names = [result["name"] for result in results]
r2_scores = [result["r2"] for result in results]

x_pos = np.arange(len(names))

axes[0].bar(
    x_pos,
    r2_scores,
    color=[
        "tab:purple" if result["name"].startswith("random") else "tab:green"
        for result in results
    ],
    alpha=0.8,
)
axes[0].set_title("Selected-feature utility")
axes[0].set_xticks(x_pos)
axes[0].set_xticklabels(names, rotation=30, ha="right")
axes[0].set_ylabel("Test R²")

r2_min = min(r2_scores)
r2_max = max(r2_scores)
r2_pad = max(0.02, 0.1 * (r2_max - r2_min))
axes[0].set_ylim(
    min(0.0, r2_min - r2_pad),
    min(1.0, max(0.02, r2_max + r2_pad)),
)
axes[0].axhline(0.0, color="black", linewidth=0.8, linestyle="--")

seed_labels = [result["name"].replace("random seed ", "") for result in random_results]
seed_pos = np.arange(len(random_results))

axes[1].bar(
    seed_pos,
    [result["overlap_with_mean"] for result in random_results],
    color="tab:blue",
    alpha=0.8,
)
axes[1].set_title("Similarity to deterministic mean tie-breaking")
axes[1].set_xlabel("Random tie-breaking seed")
axes[1].set_ylabel(f"Shared selected features out of {K_FEATURES}")
axes[1].set_xticks(seed_pos)
axes[1].set_xticklabels(seed_labels)
axes[1].set_ylim(0, K_FEATURES + 0.5)

fig.suptitle("FOCI tie-breaking comparison on synthetic data")
fig.tight_layout()
plt.show()
Total running time of the script: (0 minutes 7.112 seconds)