
Note
Go to the end to download the full example code.
FOCISelector: score progression#
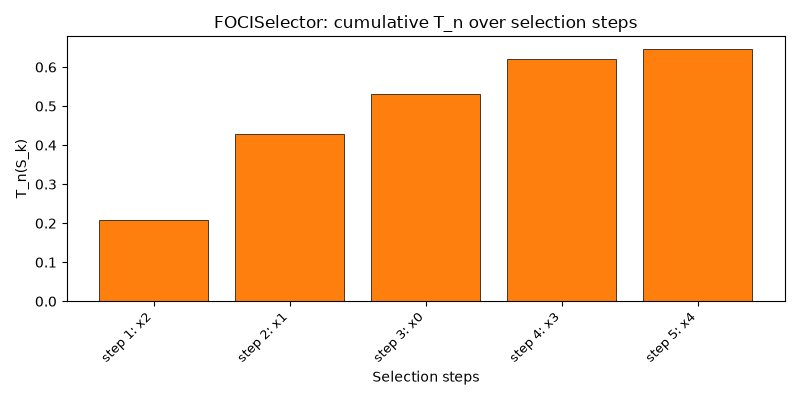
This example fits the FOCISelector on synthetic data and plots the cumulative selection score along the selection path.
import matplotlib.pyplot as plt
import numpy as np

from pyFOCI import FOCISelector

random_state = np.random.RandomState(0)
n, p = 1000, 30
X = random_state.normal(size=(n, p))

# Additive signal across multiple features
# -> incremental improvements with each addition
y = (
    np.sin(2.0 * X[:, 0])
    + X[:, 1]
    + (X[:, 2] ** 2 - 1.0)
    + np.tanh(X[:, 3])
    + (X[:, 4] > 0).astype(float)
    + 0.1 * random_state.normal(size=n)  # small noise
)

selector = FOCISelector(max_features=6, random_state=0)
selector.fit(X, y)

feat_idx = list(selector.selected_indices_)
scores = list(selector.score_path_)

# Labels: directly prepend "x" to the indices
labels = [f"step {i+1}: x{j}" for i, j in enumerate(feat_idx)]

m = len(scores)
plt.figure(figsize=(8, 4))
plt.bar(range(m), scores, color="tab:orange", edgecolor="black", linewidth=0.5)
plt.title("Score over cumulative selection steps")
plt.ylabel("Score(S_k)")
plt.xlabel("Selection steps")
plt.xticks(ticks=range(m), labels=labels, rotation=45, ha="right", fontsize=9)
plt.tight_layout()
plt.show()
Total running time of the script: (0 minutes 1.306 seconds)